Tackle common manufacturing challenges with PARCview's out-of-the box functionality.
It couldn't be easier to connect to your existing PI Historian data. Get up and running in minutes.

Don't start over from scratch! Easily import all of your PI ProcessBook displays.

Scale & save. dataPARC allows you to add unlimited users for one low price.

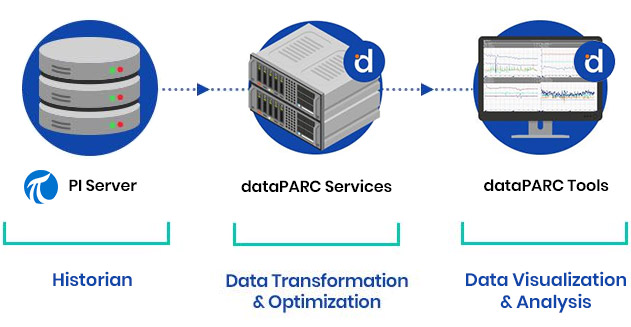
Make the transition to next-gen data visualization & analytics tools without ripping & replacing your existing PI Historian or disrupting your current IT infrastructure.
Don't start over from scratch. dataPARC offers a clear migration path for users who want to continue using critical PI ProcessBook displays & graphics.


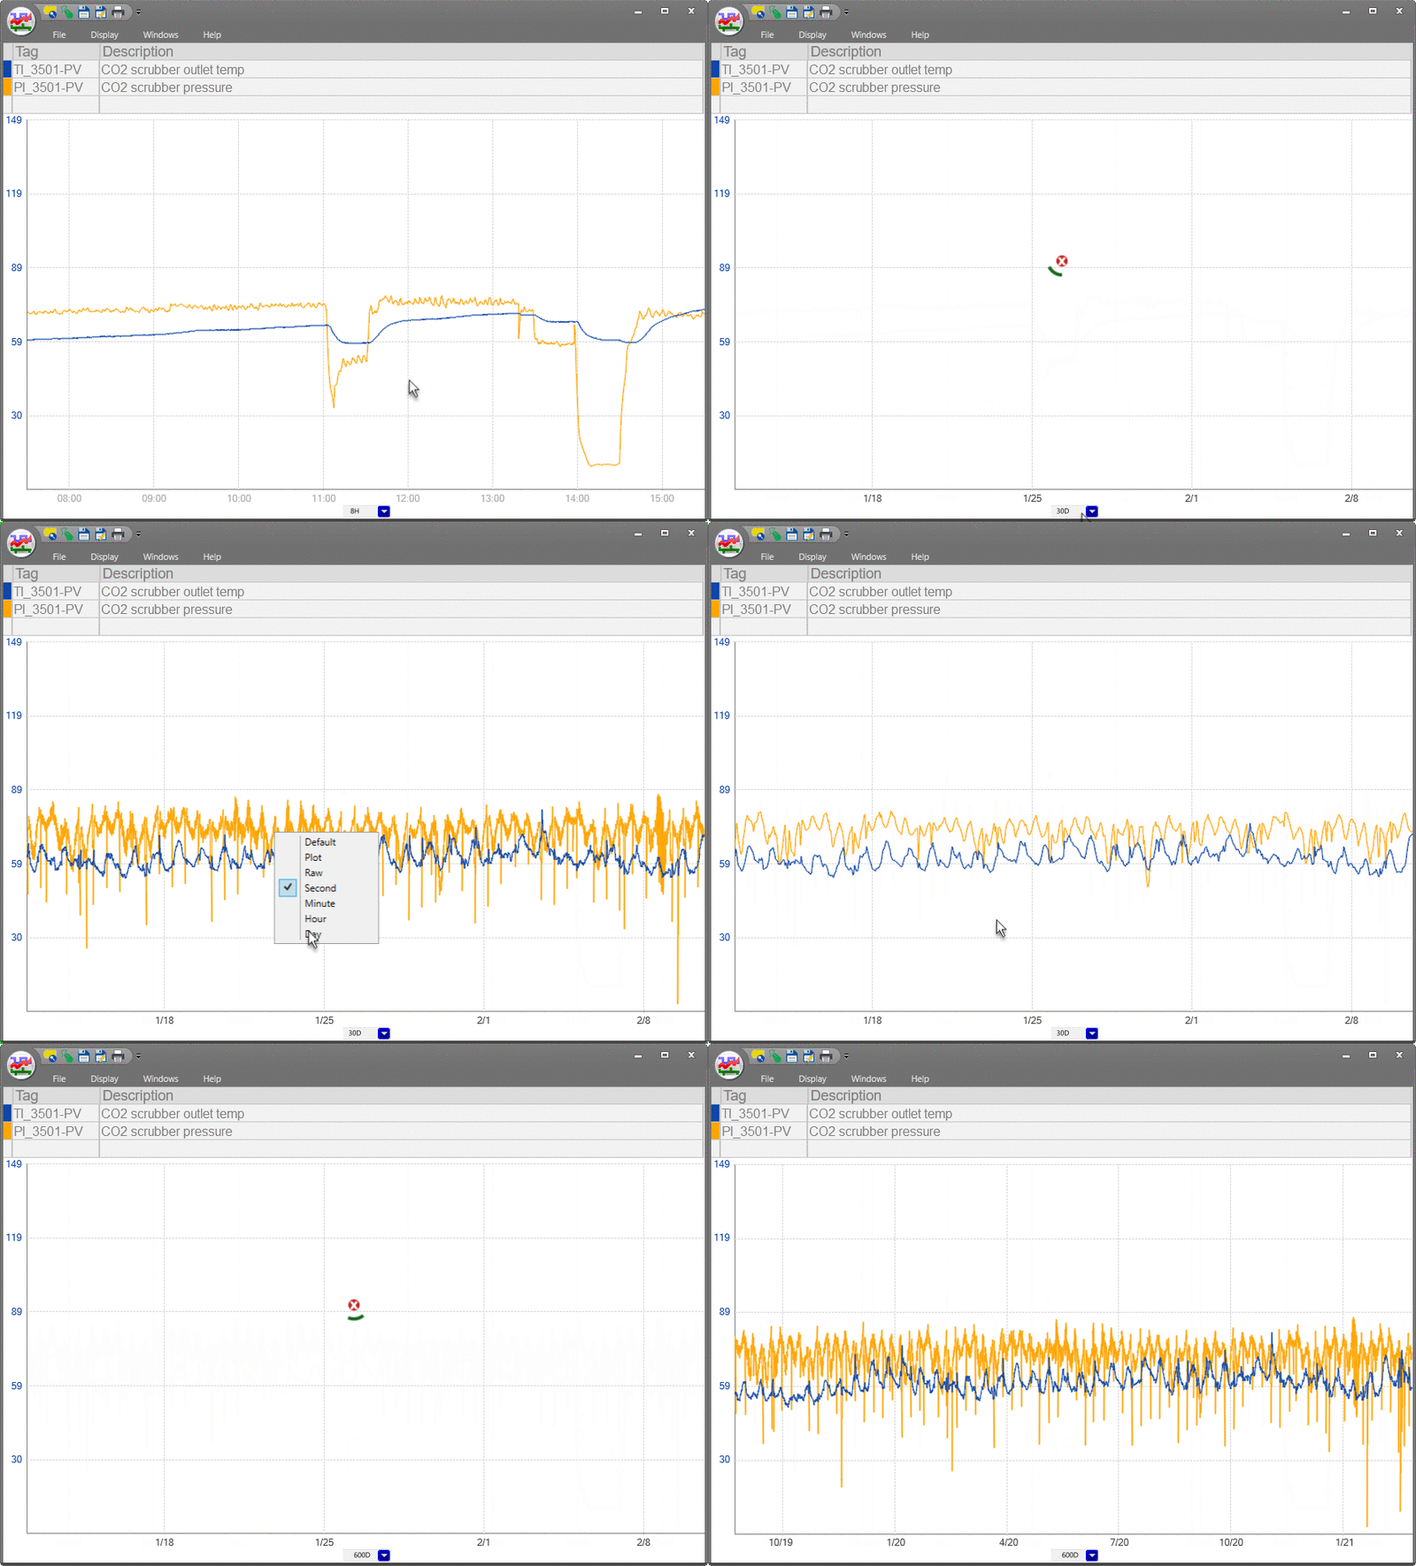
Speed up your data analysis capabilities. dataPARC's proprietary high-performance archive engine connects to PI Server and returns hours, days or months of high-resolution data within seconds, so you can get right to troubleshooting.
Mine richer insights from your data with dataPARC's industry-leading set of ad-hoc root cause analysis & trending tools.
Faster Troubleshooting How quickly can you diagnose trouble spots at your plant? It takes only 4 minutes to identify the origin of a customer's boiler efficiency problem using dataPARC's data visualization tools.
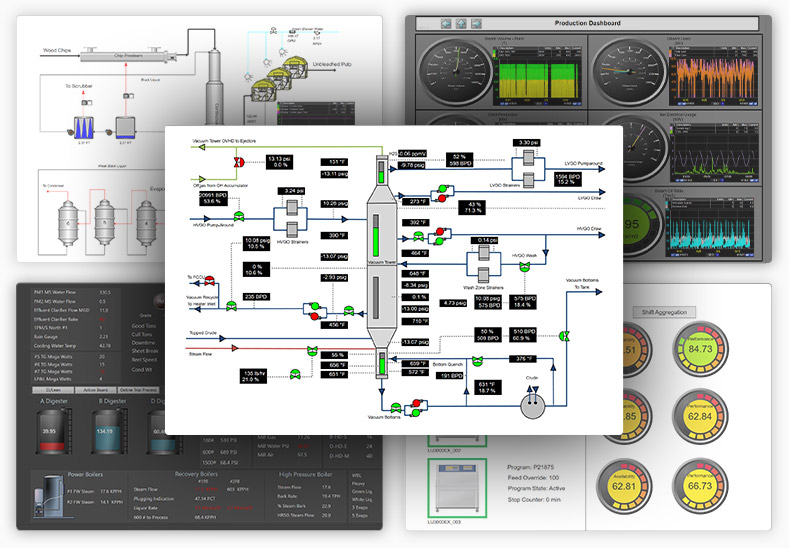
Insightful Process Displays Optimize processes from the control room. Check out how we use system control room display to identify a problem with a pesky Pressure Reducing Valve.
DataPARC's PARCview is a real-time manufacturing data visualization and analytics toolkit developed by the end user, for the end user. Quickly transform critical data into useful information for timely decision-making and root-cause analysis.
I look at dataPARC as the first step in the data journey for our company. If we're going to become a data-driven company, we have to have easy access to our data. That's the first step, and that's what dataPARC has given us.

Derek Peine, General Manager, Western Plains Energy
Our investment in dataPARC is allowing us to focus on system optimization as we leverage the data we are now capturing.

Tyler Fedun, Manager IT Operations, Energy Transfer
Instead of having only lab people using the lab database and only engineering using the process information, it's all come together. It's all available to operations, engineering, & managers.

Ryan Sullivan, Production Engineer, W.R. Grace
Tackle common manufacturing challenges with PARCview's out-of-the box functionality.
Establish a single source of truth for all your manufacturing data. Historian, ERP, MES, lab, & more.

Analyze, adjust, and control processes to drive improvements in quality & efficiency.

Monitor manufacturing production KPIs & downtime events for enterprise-wide visibility.

Real-time statistical quality control tools for continuous or batch manufacturing processes.
dataPARC is a flexible industrial analytics toolkit built upon the promise of easy data acquisition & integration. dataPARC's core building blocks can be used to build any applications to meet your needs.
Use dataPARC's rule-based alarm engine to build smart alarm definitions that reliably detect compliance events, including data loss, real time, and aggregate exceedance of regulation limits. Forward alarm event data to PARCview’s Logbook, and send notifications via email or SMS.
PARCview’s highly configurable scripting and scheduling application can schedule and deliver recurring reports or other key data to management and other decision-makers. Create event-triggered reports, dashboard report delivery, & scheduled reports.

Designed to automate common or tedious Excel tasks and make it easy to build reusable reports, PARCxla enables users to spend more time making important decisions and less time wrestling with data.
PARCgraphics Designer’s form-based MDE tools offer a platform for constructing custom data entry screens. Enter data against a record from anywhere within the dataPARC environment, across multiple MDE pages, PCs, and locations.
Arrange multiple batches by product into a comparison or consecutive view. Search for historical batches based on identifying information, such as batch ID or product label. Determine variability at any point in the batch using Run Trend analysis.
Build control charts (x-bar, range, standard deviation, etc.) from existing sources or PARCview formulas. Define simple min/max limits, choose from Western Electric Rules or custom logic. Limits can be managed natively in dataPARC or imported from a 3rd party database.
No matter what you produce, we can help.
The headline and subheader tells us what you're offering
The headline and subheader tells us what you're offering
The headline and subheader tells us what you're offering
1700 Main St., Suite 222
Washougal, WA 98671
(360) 619-5010