Using Control Room Displays for Troubleshooting
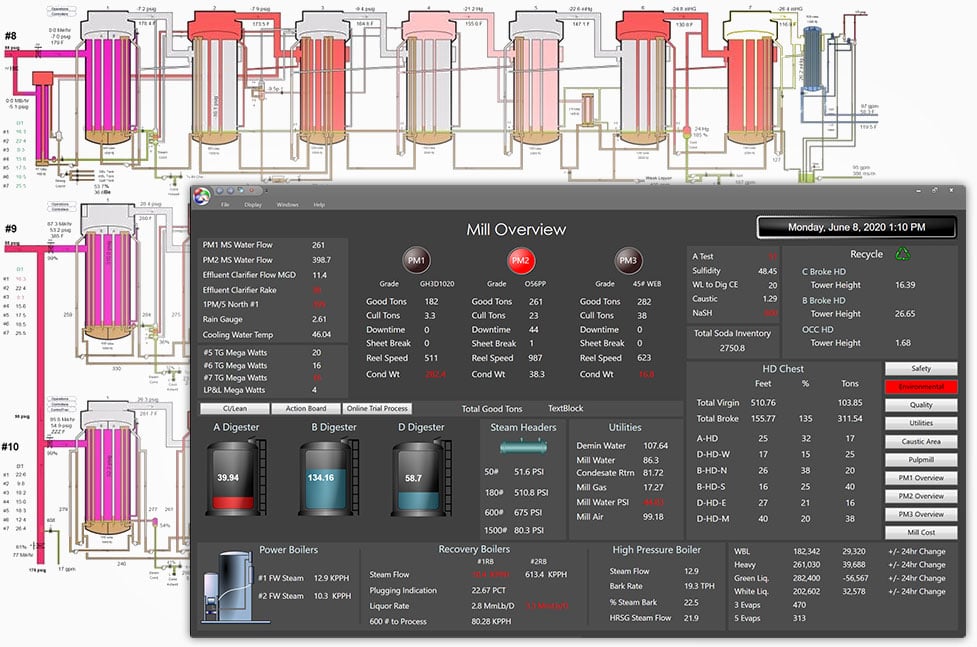
See how we use a steam system control room display to quickly identify an problem with a pesky pressure reducing valve.
Empowering Manufacturers for Over 25 Years
Our data visualization tools will give you the insights needed to quickly optimize your manufacturing processes.

Correlate process and financial data to reduce resource expenditures.
Identify, report, & troubleshoot down time, lost opportunities, & slowdowns.

Identify, diagnose, and optimize underperforming assets.

Monitor processes in real time & configure alerts for preemptive quality control.
Provide frontline visibility into environmental compliance status.

Optimize runs using historical and real-time analysis of batch processes.

Analyze and troubleshoot variable processes within a single facility.

Explore relationships between manually-entered lab data and process data

Create dynamic, data rich visualizations that provide an at-a-glance overview of the conditions and KPIs at your plant.
Dashboards
Process Graphics
1700 Main St., Suite 222
Washougal, WA 98671
(360) 619-5010